Multi-Touch Attribution: The Complete Guide for Marketers

Most marketers waste budget because they credit the wrong channels. Multi-touch attribution fixes that by splitting conversion credit across every touchpoint a customer hits before buying — not just the first or last click. It shows which channels build awareness, which drive consideration, and which close the deal.
Adoption has climbed fast. More than half of marketers were running this method in 2024, and active use holds near 47% heading into 2026. Why the shift? Single-touch models hide too much, and budgets are too tight for guesswork.
This guide breaks down the models, the tools, the math, and the honest tradeoffs you'll face. No model gets crowned king here. Let's start with what multi-touch attribution actually means.

What is multi-touch attribution?
Multi-touch attribution assigns fractional conversion credit to every marketing touchpoint a customer interacts with before buying. Not just the first click. Not just the last.
Here's the multi-touch attribution definition in plain terms: instead of handing 100% of the credit to one interaction, you split it across the whole journey. A paid ad, a blog read, an email, a branded search — each gets its slice.
Why does that matter? Because single-touch models mislead you. Last-click attribution credits only the final step, so a Google ad that closed the sale looks like a hero while the email that warmed the lead gets nothing. Only about 21.5% of marketers feel confident that last-click reflects a channel's long-term impact, according to EMARKETER data. That's a lot of guesswork driving real budgets.
Adoption has caught up. More than half of marketers were using multi-touch attribution in 2024, and active use sits near 47% heading into 2026. The payoff is sharper spending — teams running multi-touch attribution typically allocate budgets 15–30% more efficiently than single-touch users.
Think of it as a fair scoring system for your marketing. To understand why that matters, it helps to see how the mechanics actually work.
How multi-touch attribution works
So how does multi-touch attribution work under the hood? It runs on four moving parts: touchpoint identification, data collection, journey mapping, and credit distribution.
First, the data gets collected. Multi-touch attribution pulls signals from three main sources: UTM parameters tagged onto your links, JavaScript calls firing on your site, and API connections to your CRM and ad platforms. Together they capture which source, campaign, and creative brought each visitor in.
Then those signals get stitched into one customer journey. Picture a buyer who clicks a paid ad, opens an email three days later, runs an organic search, then purchases. Each is a separate touchpoint, and the system links them to a single user ID.
Here's the thing: that stitching is where it gets hard. Identity resolution depends on deterministic IDs like a login or email. Signal loss from iOS consent changes can wipe out a substantial share of paid social conversion data, leaving meaningful gaps in the customer path.
The journey now spans more steps than ever — an average of 11.1 touchpoints before purchase in 2025, per NP Digital. Analytics tools then split credit across them, and your organic search analytics finally show their real weight.
The model you choose decides how that credit gets split — so let's walk through the main options.
Multi-touch attribution models explained
Your multi-touch attribution model decides how credit gets split across touchpoints. The best one typically depends on three things: sales cycle length, funnel complexity, and data maturity.
Five models cover most needs.
The linear model gives equal credit to every touchpoint — simple, but blind to which step mattered most. The time-decay model favors touchpoints near conversion, suiting short consideration windows. The U-shaped (position-based) model gives the heaviest credit to the first and last touchpoints, with the middle interactions sharing the remaining credit.
For longer funnels, the W-shaped model splits credit across first touch, lead creation, and opportunity creation — a B2B SaaS favorite. Custom and data-driven models use machine learning like Markov chains or Shapley values, the most accurate in theory but demanding large, clean data.
Which one fits your funnel? Start rule-based, then graduate.
Attribute | Linear | Time-decay | U-shaped | W-shaped | Data-driven |
|---|---|---|---|---|---|
Credit logic | Equal split | Recency-weighted | 40/20/40 | Three milestones | Algorithmic |
Best fit | Simple funnels | Short cycles | Clear handoffs | B2B pipeline | High-volume data |
Data needs | Low | Low | Low | Medium | High |
Most analytics tools support several of these. Among enterprises earning $250M+, 73% now run multi-touch attribution models.
Before committing, understand how multi-touch attribution compares to marketing mix modeling.
Multi-touch attribution vs. marketing mix modeling
These methods answer different questions, so the multi-touch attribution vs. marketing mix modeling debate isn't really about picking a winner.
MTA works at the user level. It tracks individual touchpoints across digital channels and supports daily optimization. MMM is aggregate and statistical — it uses historical spend to capture offline channels like TV and long-term brand effects.
Attribute | MTA | MMM |
|---|---|---|
Data level | User-level | Aggregate |
Best for | Digital optimization | Strategic allocation |
Captures offline | No | Yes |
Speed | Real-time | Historical |
Reach for MTA when cycles run under 7 days and you log 1,000+ monthly conversions. Lean on MMM when offline spend tops 30% or cycles stretch past 30 days.
Which wins? Neither, in most cases. The 2026 best practice is a hybrid — unified marketing measurement — using MTA for tactics and MMM for strategy. Privacy signal loss is fueling this revival. One unified approach generated $74 million in incremental revenue in six months. Your benefits of SEO for your marketing mix show up clearly in both lenses.
Now, two concrete multi-touch attribution examples.
Multi-touch attribution examples
The fastest way to see why model choice matters? Watch the same sale split two different ways.
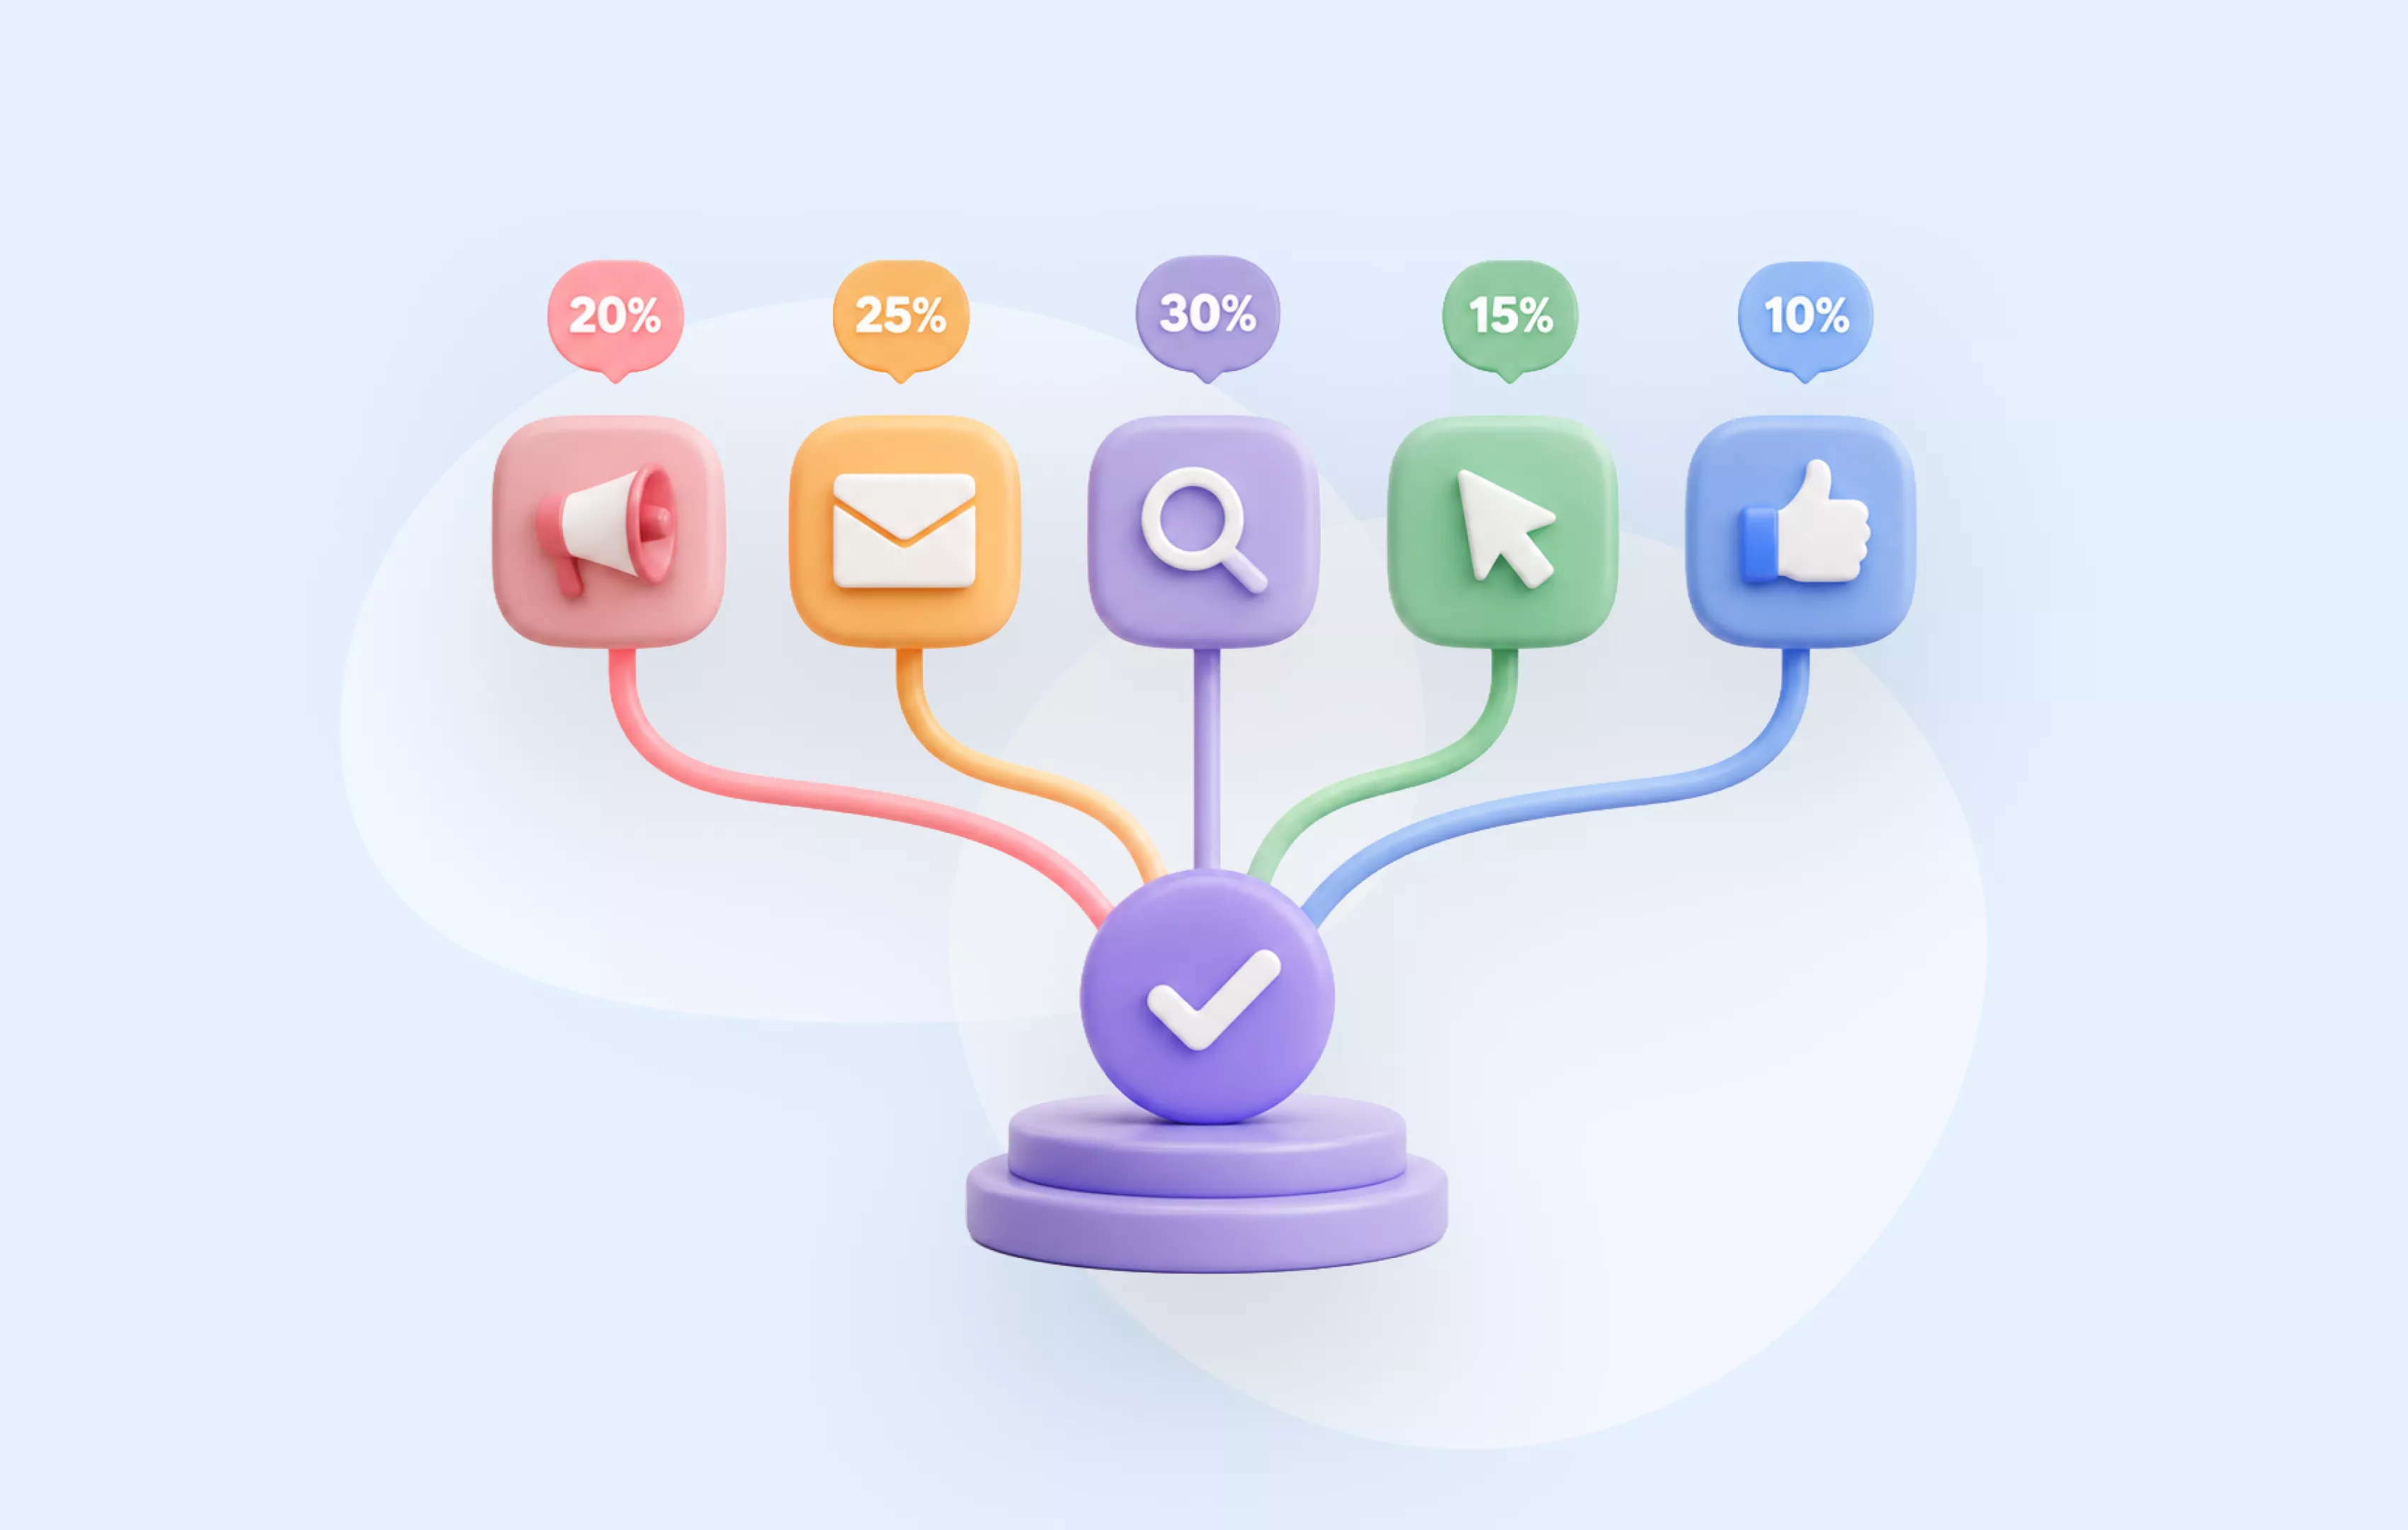
Take an e-commerce customer journey. A shopper clicks a Meta ad on Day 1, a Google Shopping ad on Day 2, an email discount on Day 4, then converts via branded search on Day 6 for $200. A linear multi-touch attribution model gives each of those four touchpoints 25% credit — $50 apiece. Time-decay flips that, handing the most credit to the recent branded search and email while the early Meta ad gets pennies.
That gap changes budgets. These examples show time-decay can systematically undervalue early awareness work — a real problem for longer cycles.
Now a B2B SaaS journey with a 6-month cycle. Here a W-shaped model fits better, splitting 30% each to first touch, lead creation, and opportunity creation. One Series B team switched from last-touch to W-shaped, made webinars and nurturing emails visible, and scaled pipeline 2.4x in two quarters.
The same paid search click shifts in value depending on the model you choose. Your content distribution strategy depends on getting that credit right.
Now that you can picture how attribution models play out in practice, the next step is knowing which tools can actually run them for you.
Top multi-touch attribution tools in 2026
No single platform wins for everyone. The right pick typically hinges on your business model, data volume, and budget. Here are six multi-touch attribution tools worth a look, each with one clear strength.
Attribute | Rockerbox | Triple Whale | Northbeam | GA4 | HubSpot | Ruler |
|---|---|---|---|---|---|---|
Best for | Omnichannel enterprise | DTC unit economics | High-spend DTC | Low-volume baseline | HubSpot teams | Inbound lead-gen |
Standout | TV + offline | CAC and LTV | ML attribution | Free start | CRM-native | Calls and forms |
Rockerbox is the enterprise choice for omnichannel — TV, podcasts, and direct mail alongside digital. Triple Whale ties attribution to unit economics, so DTC founders see channel-level margin. Northbeam suits brands spending $250K+/month, pairing machine learning with incrementality testing.
Need a free start? Google Analytics 4 works at low volumes, but its data-driven model needs 300–400 monthly conversions per action or it quietly reverts to last-click. HubSpot Marketing Hub fits teams already living in that CRM. Ruler Analytics nails phone calls and form fills.
These tools shape how marketing agencies measure ROI. Want one place to run your multi-touch attribution model and content? Start your free trial and manage all your content in one place.
Choosing a tool is only half the battle. Here is a step-by-step process for getting multi-touch attribution running.
How to implement multi-touch attribution
Implementing multi-touch attribution follows five sequential steps. Skip one, and your reports get shaky.
Step 1: Audit your current tracking setup
Start with your tracking. Check UTM consistency across every link, confirm CRM connections fire, and flag data gaps. Messy tags ruin everything downstream.
Step 2: Define your customer journey stages and conversion event
Pick one clear conversion event — a purchase, demo request, or subscription. Then map the customer journey stages and every touchpoint, from paid search to email to landing pages.
Step 3: Choose a model aligned to your funnel
Match the model to your sales cycle and data maturity. U-shaped fits clean handoffs; W-shaped suits lead-driven funnels. Most teams should start with rule-based multi-touch attribution models before moving to algorithmic ones.
Step 4: Integrate your analytics tool and resolve identity
Connect your tool, then tackle cross-device identity. If a buyer browses on mobile and converts on desktop, cookie-based systems count two people — and your attribution goes sideways. First-party cookies and visitor IDs stitch sessions together properly.
Step 5: Review and iterate
Pilot test models, watch KPIs like ROAS, and update as channels shift. How does multi-touch attribution hold up long-term? With cookie deprecation widening blind spots, consented first-party data is the clearest path forward.
Below are observations from running attribution projects across different client types.
What we've seen work: lessons from real attribution projects
Patterns repeat across e-commerce and B2B SaaS projects. A handful separate teams that act from teams that just file reports nobody opens.
The first pattern is the loudest: teams that act on attribution data outperform teams that only report it. Model simplicity beats analysis paralysis. A rough multi-touch attribution model you adjust weekly wins over a perfect one collecting dust.
Second, start with a rule-based model — U-shaped or W-shaped — before moving to data-driven. Most teams lack the conversion volume for clean machine learning anyway.
Third, match your attribution windows to your sales cycle. Default 30-day windows systematically under-report long-cycle B2B, hiding the early touchpoints that started the customer journey months back. Want accurate credit? Stretch the window to fit reality.
Fourth, pair multi-touch attribution with incrementality testing. Attribution shows credit; incrementality shows true lift. Run a holdout test, and you'll see which channels actually drive new conversions versus which just capture demand you already had.
If you still have specific questions about how multi-touch attribution applies to your situation, the FAQ section below covers the most common ones.
Putting multi-touch attribution to work
Here's the thing: attribution only pays off when you act on it.
Pick a model that matches your sales cycle. Start rule-based — U-shaped or W-shaped — before reaching for machine learning. Stitch your touchpoints with first-party data, stretch your windows to fit reality, then pair the whole thing with incrementality testing.
You don't need a perfect setup on day one. A rough multi-touch attribution model you review weekly beats a flawless one nobody opens. Ask yourself: are you crediting the channels that close, or the ones that warm? That answer reshapes budgets fast.
Want more practical playbooks like this one? Browse our marketing blog for deeper guides.
Bottom line: measure the full journey, then move money where it works. Start your free trial and manage all your content in one place.